Right menu

Featured resource


Media > TDT > Statistics > S_BI_I1_E1_fig1
S_BI_I1_E1_fig1

« 
Previous image
|
|
Next image
 »

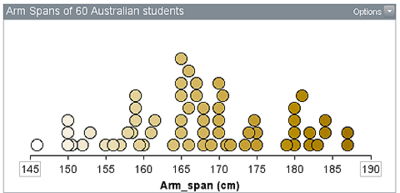
Dot plot shows minimum 145 cm, maximum 187 cm with an approximately normal distribution, peak at 165 cm.

Arm spans of 60 Australian students.

Related content