Home > Topdrawer > Statistics > Activities > Interpreting box plots
Interpreting box plots
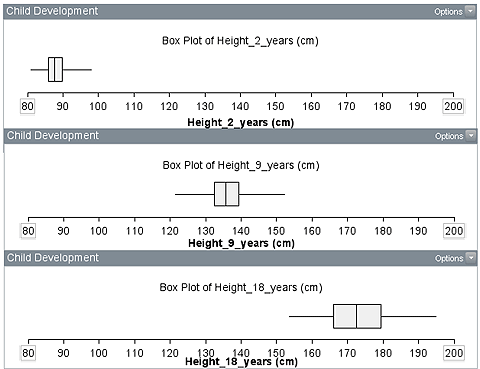
The first three box plots show the heights of 136 people at ages 2, 9 and 18 years.
What differences do you observe?
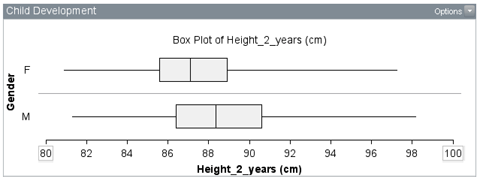
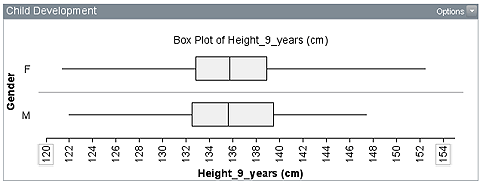
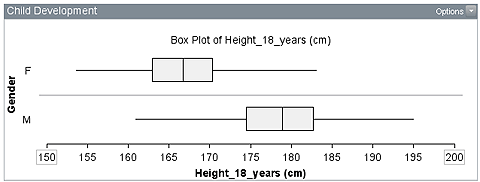
The next three pairs of box plots show the heights of the 136 people separated by gender at each age level.
What differences do you observe now?
How confident are you in the differences between the populations represented?
There are other activities available in difficulties with informal inference.


